


You’ve got the vision, the drive, and the determination, but are you working smart, with the right tools and focus?
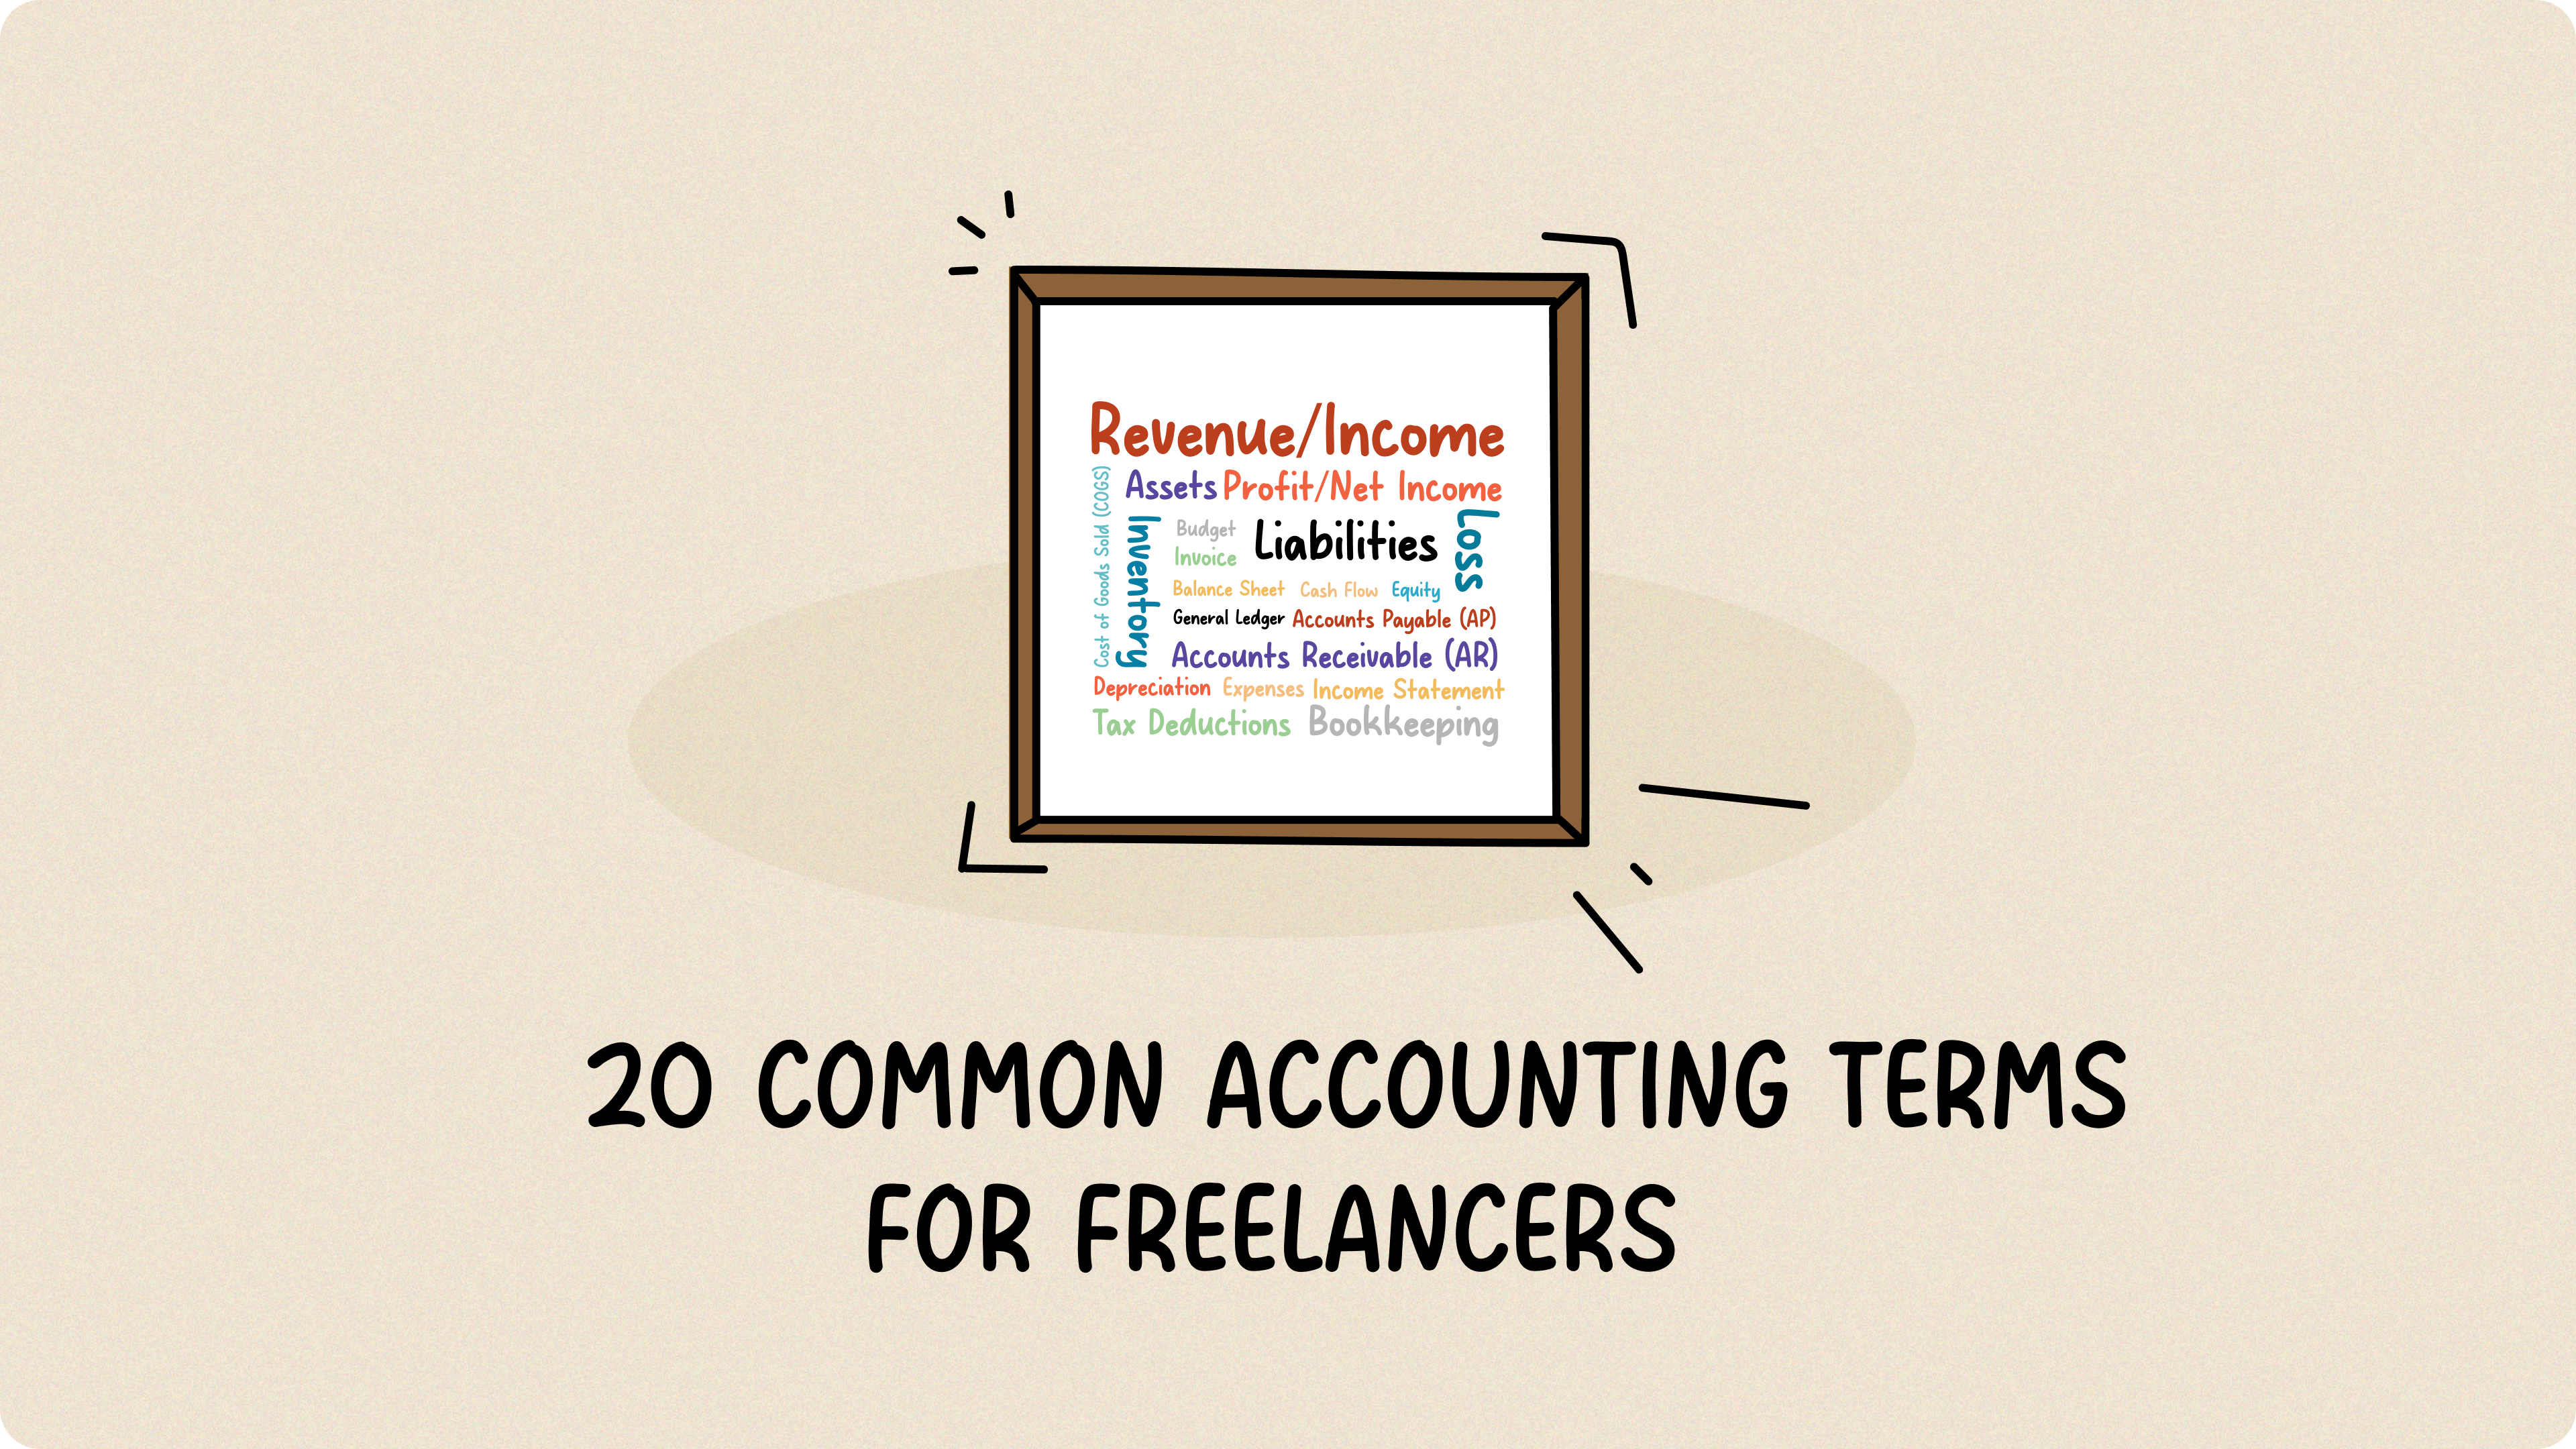
Successful entrepreneurs don’t rely on passion alone, they rely on the numbers. They don’t just guess, they measure. For those just starting their financial journey, understanding some key terms is crucial, so we’ve put together a guide on 20 Common Accounting Terms for Freelancers to help you get started. Now, for those ready to dive deeper, we asked real business owners which financial metrics they track to stay profitable and sustainable. Here are 23 they recommend.
Explore the 23 Metrics
- Operating Margin
- Gross Profit Margin
- Net Profit Margin
- Current Ratio
- Average Revenue per Customer
- Break-Even Point
- Debt-to-Equity Ratio
- Bounce Rate
- Customer Acquisition Cost (CAC)
- Cash Flow
- Burn Rate
- Net Working Capital Ratio
- Cash Conversion Cycle
- Customer Lifetime Value (CLV)
- Budget Variance
- Interest Coverage Ratio
- Inventory Turnover Ratio
- Days Sales Outstanding (DSO)
- Average Order Value (AOV)
- Lead-to-Customer Conversion Rate
- Working Capital
- Quick Ratio
- Return on Assets (ROA)
Let’s dive into each metric, starting with:
1. Operating Margin
When you want to see how well your core business is performing, look at the operating margin. It tells you the profit you’re making from your primary operations, before interest and taxes. This is indicator of how efficiently you’re running things. A healthy operating margin suggests your business is fundamentally strong and sustainable.
Operating Margin = (Operating Income / Revenue) × 100%
2. Gross Profit Margin
This metric measures the efficiency of your production or service delivery. It shows the percentage of revenue remaining after covering the direct costs of creating a product or providing a service. This helps you understand how well you’re managing those core costs. Higher margins generally indicate efficient operations.
Gross Profit Margin = (Revenue – Cost of Goods Sold) ÷ Revenue × 100%
3. Net Profit Margin
The net profit margin represents the ‘bottom line’ of a business, indicating the percentage of revenue remaining after all expenses, including taxes and interest, have been paid. This metric provides a straightforward assessment of your business’s overall profitability and serves as a key measure of financial success.
Net Profit Margin = (Net Profit ÷ Revenue) × 100%
4. Current Ratio
This ratio shows if you have enough liquid assets to cover your short-term liabilities, giving you a quick snapshot of your financial health. While a number above 1 means you can generally pay your immediate bills, a current ratio between 1.5 and 3 is often considered ideal, suggesting a healthy balance.
Current Ratio = Current Assets ÷ Current Liabilities
5. Average Revenue per Customer
Knowing how much each customer spends on average is key for pricing strategies and understanding customer value. It helps you figure out how to maximize revenue from your existing customer base. This represents the average value each customer brings to your business.
Average Revenue per Customer = Total Revenue ÷ Total Number of Customers
6. Break-Even Point
This is where your revenue and total costs meet. It’s the point where you’re neither making nor losing money. It’s crucial for setting sales targets and understanding how many units or services you need to sell to start turning a profit.
Break-even Point = Fixed Costs ÷ (Selling Price per Unit – Variable Cost per Unit)
7. Debt-to-Equity Ratio
This ratio shows how much of your business is financed by debt compared to equity. It’s a key indicator of financial leverage. A lower ratio often signals a more stable financial structure, as it means you’re relying less on borrowed funds.
Debt-to-Equity Ratio = Total Liabilities ÷ Total Shareholders’ Equity
8. Bounce Rate
Bounce rate represents the percentage of visitors who land on your website and leave without clicking through to any other pages. For online businesses, it’s a key indicator of how well your landing pages are performing. A high bounce rate may suggest that visitors aren’t finding what they expected, or that the content isn’t engaging enough to prompt further exploration. This can be caused by slow load times, confusing layouts, irrelevant content, or a mismatch between your ads and what’s actually on the page. Reducing your bounce rate often starts with improving the first impression—through better design, clearer calls to action, and more targeted content.
Bounce Rate = (Single-page Visits ÷ Total Website Visits) × 100%
9. Customer Acquisition Cost (CAC)
Want to know if your marketing dollars are working hard enough? This metric tells you exactly how much it costs to acquire a new customer. It’s vital for understanding the efficiency of your marketing and sales efforts, and keeping CAC in check ensures your customer acquisition strategy is sustainable and profitable.
CAC = Total Marketing and Sales Expenses ÷ Number of New Customers Acquired
10. Cash Flow
Cash flow tracks the movement of money in and out of your business. It’s about having enough liquid cash to cover your expenses and invest in growth. Positive cash flow is essential for the day-to-day running of your business. Want to stay ahead? Find out more about cash flow projection here.
Cash Flow = Cash Inflows – Cash Outflows
11. Burn Rate
Especially important for startups, this metric measures how quickly you’re spending your cash reserves. It helps you understand how long your runway is and plan accordingly. It’s a key tool for managing your finances in the early stages.
Burn Rate = (Starting Cash – Ending Cash) ÷ Number of Months
12. Net Working Capital Ratio
This ratio looks at your short-term financial health. It compares your current assets to your current liabilities, giving you an idea of your ability to cover immediate obligations. It’s a quick check on your liquidity.
Net Working Capital Ratio = Current Assets ÷ Current Liabilities
13. Cash Conversion Cycle
This metric measures how long it takes to convert your inventory and resources into cash from sales. A shorter cycle means you’re more efficient at turning your investments into cash, which is always a good thing.
Cash Conversion Cycle = Days Inventory Outstanding + Days Sales Outstanding – Days Payable Outstanding
14. Customer Lifetime Value (CLV)
CLV is your guide to building relationships that truly pay off. It estimates the total revenue a customer will generate throughout their journey with you, making it clear why focusing on long-term relationships and retention is so important for your business’s bottom line.
CLV = Average Purchase Value × Purchase Frequency × Customer Lifespan
15. Budget Variance
This metric compares your planned financial performance with your actual results. It helps you stay on track with your financial goals and identify areas where you might need to make adjustments.
Budget Variance = Actual Amount – Budgeted Amount
16. Interest Coverage Ratio
This ratio is your confidence score with lenders. It demonstrates how comfortably you can cover your interest expenses with your earnings. A solid score signals robust debt management and financial stability, making you a more attractive borrower.
Interest Coverage Ratio = Earnings Before Interest and Taxes (EBIT) ÷ Interest Expenses
17. Inventory Turnover Ratio
This metric is all about turning inventory into cash, fast. It measures how quickly you’re selling and restocking. A high turnover rate translates to efficient capital use and strong sales momentum. In other words, your money isn’t tied up in slow-moving goods.
Inventory Turnover Ratio = Cost of Goods Sold ÷ Average Inventory
18. Days Sales Outstanding (DSO)
DSO tells you how long it takes, on average, to collect payment from your customers after a sale. A lower DSO means you’re getting paid faster, which improves your cash flow.
DSO = (Accounts Receivable × Number of Days) ÷ Total Credit Sales
19. Average Order Value (AOV)
This metric reveals customer spending patterns, specifically the average amount spent per order. By analyzing this data, businesses can fine-tune their pricing and promotional strategies to maximize sales.
AOV = Total Revenue ÷ Number of Orders
20. Lead-to-Customer Conversion Rate
This metric measures the percentage of leads that become paying customers. It’s crucial for understanding the effectiveness of your sales and marketing funnel. It tells you how well you’re turning potential customers into actual ones.
Conversion Rate = (Number of New Customers ÷ Number of Leads) × 100%
21. Working Capital
Working capital is your business’s financial flexibility. It’s the gap between your current assets and liabilities, representing the resources you have to work with daily. A positive working capital position translates to the ability to seize opportunities and handle unexpected expenses.
Working Capital = Current Assets – Current Liabilities
22. Quick Ratio
Can you pay your bills right now, without selling inventory? This ratio gives you the answer. It’s a stricter look at your short-term liquidity, focusing only on your most liquid assets. It’s your immediate financial flexibility indicator.
Quick Ratio = (Current Assets – Inventory) ÷ Current Liabilities
23. Return on Assets (ROA)
ROA is your investment efficiency metric. It shows how well you’re leveraging your assets to create profit. A higher ROA means you’re getting more bang for your buck from your assets, driving overall profitability.
ROA = Net Income ÷ Total Assets
Tracking the right financial metrics gives you clarity, control, and confidence in your business decisions. It’s not just about tracking dollars and cents. It’s about understanding how your business is performing, where you can improve, and how to plan for growth.
If you’re ready for expert support, Fynlo is here to help. Our accountants bring years of experience from top firms like the Big Four, BDO, and Grant Thornton. We also take confidentiality seriously—every client relationship is protected by a signed NDA.
Need a hand with your books? Schedule a call and let’s make your finances simpler, smarter, and more secure.